Wednesday, September 15, 2010

Treemap


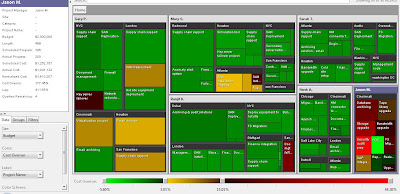
[Treemap applied to project portfolio management]

Tree maps maps aid in identifying critical issues, allocating resources and finding trends or relationships in data sets by showing the line items from datasets in a visual format that the brain is more capable of percieving. This allows anomolies, distributions, relationships and trends to be identified. 

Treemaps are often applied to stock market analysis, risk management, project portfolio analysis, market share analysis and network management.


[Treemap applied to vehicle fleet management]

Heat map

A heat map is an information visualization technique that uses color to represent attributes of information in a two-dimensional image. Heat maps use shades or colors to differentiate values in a data set or to identify focus areas in a data set. Different colors indicate an anomaly (eg: red in a group that is mostly green), consistent colors in a group indicate a trend.


Heatmap software technologies allow users to conduct ad hoc re-grouping, filtering, searching, selecting, exporting, printing and importing from external data sources. [Commercial software] [cheap / free treemap software]

The University of Maryland has an excellent history and explanation of heatmaps and coverage of treemap software offerings. There is an extensive set of variations of how to implement heatmap visualization.

There are different types of heat maps. The two most commonly used heatmap types are treemaps and geographic (thematic) maps.

My first data visualisation

So I have recently become interested in data visualisation and decided to start a blog about it.

For me the purpose of visualising data is to enable the viewer to comprehend the meaning of the data more easily than if the data were presented in another format, say textual or tabular.

This vizualisation of data is the first produced by me. I created it using Jonathan Feinberg's wonderful Wordle Tool. As you will soon realise I am totally contradicting what I said above about the purpose of visualising data, it is really just a pretty image to start my blog.