"[D]ata visualization deals with so-called abstract data, which has no physical presence in reality, such as measurements in economic, networking or social sciences."
from "Aesthetic data visualisation as a resource for educating creative design" by Andrew Vande Moere
Data visualisation is part of a contunuum of disciplines spanning scientific visualisation, data visualization and 'visualisation art' where data may be used as the construct (shown below) however semantic meaning becomes progressively less prevalent as the continuum progresses from left ot right.
This blog exists a s a record of my own exploration of data visualization as I work towards the outcome of being better able to present complex business concepts to executive business leaders in a simpler, more effective way.
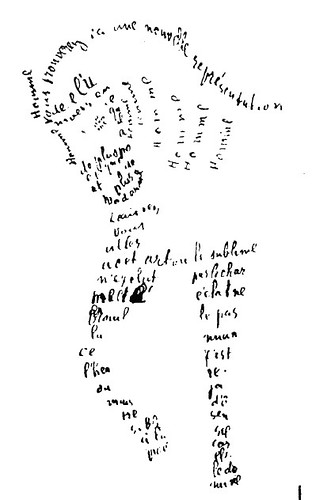
[source: Guillaume Apollinaire's - horse calligram]
Data visualization is important in decision making for businesses.
ReplyDeleteData Visualization
We at COEPD provides finest Data Science and R-Language courses in Hyderabad. Your search to learn Data Science ends here at COEPD. Here, we are an established training institute who have trained more than 10,000 participants in all streams. We will help you to convert your passion to learn into an enriched learning process. We will accelerate your career in data science by mastering concepts of Data Management, Statistics, Machine Learning and Big Data.
ReplyDeletehttp://www.coepd.com/AnalyticsTraining.html